 Seoul Window
The short answer
- Myeongdong is still number one. In the government's 2025 International Visitor Survey, 17.3% of visitors named it their favourite place in Korea, more than twice anywhere else.
- Seongsu is the fastest riser. Its share went 1.1% → 2.5% → 5.0% from 2023 to 2025, and 9.6% in provisional figures for April–June 2026.
- Our count of Seoul's living-population data shows a big shift between neighbourhoods from July 2019 to July 2026: Seongsu up about elevenfold, the Dongdaemun area down about 29%, while the city-wide estimate stayed about the same.
- For your trip: Myeongdong for shopping, exchange and street food, Seongsu for cafés and pop-ups. Many visitors now do both.
Ask a Korean where tourists go in Seoul and you will hear one answer: Myeongdong. Ask someone who has been to Seoul twice since 2024 and you will hear another: “Have you been to Seongsu?” Both are right, and the data shows why.
This article puts several sources side by side: the government’s official International Visitor Survey, Seoul’s living-population data (which we processed ourselves, dong by dong), card spending, subway ridership and shop vacancy rates. Each source measures something different, so read each chart’s label carefully. For the bigger picture of who visits Korea, see our Numbers pages on what visitors do and who visits Korea most.
Is Myeongdong still the most popular place for tourists in Seoul?
Yes. Myeongdong is the place foreign visitors name most often as their favourite, and its lead grew in 2025. In the 2025 International Visitor Survey, run by the Ministry of Culture, Sports and Tourism (MCST) and the Korea Culture and Tourism Institute (KCTI) with 16,110 departing visitors, 17.3% picked Myeongdong as their favourite place, up from 16.1% in 2024. Provisional figures for April–June 2026 put it at 18.3%.
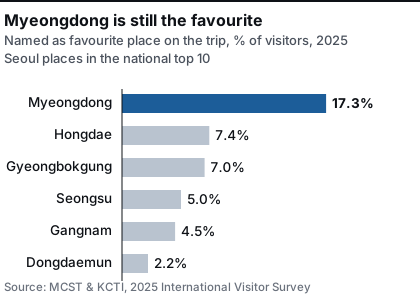
Other measures agree that Myeongdong is still the busiest tourist district by far:
- Foot traffic: the Seoul AI Foundation, analyzing roaming and arrival data, counted an average of 100,910 foreign visitors a day in Myeongdong in 2025, ahead of N Seoul Tower (57,370), Samseong Station and COEX (46,813), Gangnam Station (41,210) and Hongdae (40,213) (Newsis, July 2026).
- Subway: Myeongdong Station had the most foreign riders on Seoul Metro’s network in 2024, 2,747 a day, ahead of Hongik University Station (1,692) and Euljiro 1-ga (1,216) (Seoul Metro data reported by Financial News).
Background: why you can't compare 2019 and 2025 directly
- The 2019 survey asked visitors to pick their "most impressive" places from a list, with multiple answers allowed. Myeongdong, Namdaemun and Bukchang together got 55.9%, followed by the Dongdaemun fashion district (24.7%) and Sinchon/Hongdae (18.0%). Seongsu was not even on the list.
- Since 2023 visitors write in their favourite place (more than one answer allowed) instead of choosing from a list. Neither survey lists places visited within Seoul, and the percentages cannot be compared with 2019's.
How fast is Seongsu growing with foreign tourists?
Its share of “favourite place” answers has roughly doubled every year since 2023. In 2025, the survey report noted, Seongsu rose among visitors from every country it tracks. The provisional April–June 2026 figure, 9.6%, is almost double the 5.2% of the same quarter a year earlier.
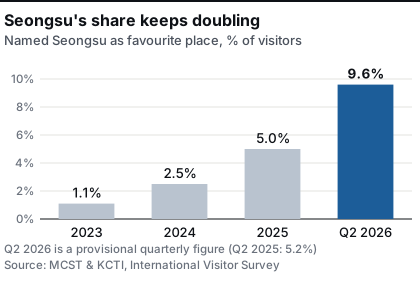
Japanese visitors lead the trend: 11.5% of them named Seongsu their favourite place in 2025. By group, Seongsu scored highest with women (7.0%), people in their twenties (8.7%) and visitors on their fourth trip or more (7.0%). In other words, Seongsu is where repeat visitors go once they have done the classics.
🌏 Share of visitors naming Seongsu their favourite place, by country (2025 International Visitor Survey)
| Country or territory | 2024 | 2025 |
|---|---|---|
| Japan | 7.6% | 11.5% |
| Hong Kong | 2.1% | 7.2% |
| Singapore | 2.4% | 5.3% |
| Indonesia | 1.2% | 5.3% |
| China | 1.1% | 3.8% |
| Taiwan | 1.2% | 3.4% |
| United States | 0.9% | 2.0% |
| Thailand | 0.0% | 0.3% |
Myeongdong is the opposite story by country: Hong Kong (26.9%) and Thai (25.2%) visitors named it most strongly, and for Thai, Vietnamese and French visitors, Gyeongbokgung Palace ranked near the top.
Why Seongsu? It packs the things repeat visitors search for into a few walkable blocks: K-beauty flagships, Korean designer fashion, pop-up stores and warehouse cafés. CJ Olive Young says foreign customers made up about 70% of sales at its six Seongsu stores in October 2025, up from about 40% before its flagship opened. For where to go once you are there, see our guides to Seongsu cafés and old vs new restaurants in Seongsu.
What does Seoul's own data say about where tourists are?
Seoul’s living-population data shows about the same number of short-term foreign visitors in the city as before the pandemic, spread across more neighbourhoods. We downloaded the Seoul Open Data Plaza dataset for short-term foreign stays (estimated from public and telecom data) and averaged every hour of July for each administrative dong. July 2019 and July 2026 are both full months, so they compare like with like.
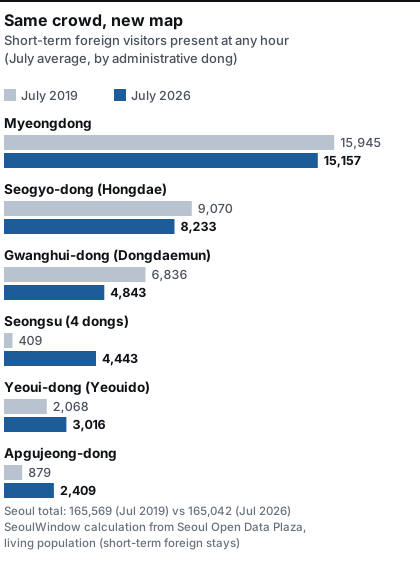
📊 Short-term foreign visitors present at an average hour in July, by administrative dong (SeoulWindow calculation)
| Area (administrative dong) | July 2017 | July 2019 | July 2026 | 2019 → 2026 |
|---|---|---|---|---|
| All of Seoul | 187,707 | 165,569 | 165,042 | About the same |
| Myeongdong | 23,929 | 15,945 | 15,157 | −5% |
| Sogong-dong (City Hall, Lotte Department Store) | 10,800 | 7,313 | 5,246 | −28% |
| Hoehyeon-dong (Namdaemun) | 6,275 | 5,717 | 4,411 | −23% |
| Gwanghui-dong (DDP, Dongdaemun) | 8,386 | 6,836 | 4,843 | −29% |
| Seogyo-dong (Hongdae) | 6,768 | 9,070 | 8,233 | −9% |
| Seongsu (4 dongs combined) | 583 | 409 | 4,443 | About 11× |
| Yeoui-dong (Yeouido) | 2,533 | 2,068 | 3,016 | +46% |
| Apgujeong-dong | 1,261 | 879 | 2,409 | About 2.7× |
| Jamsil 6-dong (Lotte World) | 1,030 | 1,133 | 1,524 | +35% |
| Itaewon 1-dong | 1,624 | 1,225 | 951 | −22% |
Three things stand out. Myeongdong dropped sharply between July 2017 and July 2019 and has been roughly flat since. The old shopping belt around it (Sogong-dong, Namdaemun, Dongdaemun) is still well below 2019. Meanwhile Seongsu, Yeouido (the Hyundai Seoul and the Han River parks) and Apgujeong (Gangnam’s designer streets and clinics) have grown.
How we counted
- Source: Seoul Open Data Plaza, OA-14993, "Seoul living population by administrative dong (short-term foreign stays)". The figure is an estimate of how many short-term foreign visitors are present in a dong at a given hour, not a count of visits.
- We averaged all hours of each July. Seongsu = Seongsu 1-ga 1, Seongsu 1-ga 2, Seongsu 2-ga 1 and Seongsu 2-ga 3 dong.
- Seoul's total for 2025–2026 is below 2017 even though national arrivals passed 2019 levels, so changes in how the estimate is made (roaming, local SIMs) may play a part. Read the table for relative change between neighbourhoods rather than absolute numbers. Seoul says this dataset is being replaced by 250 m grid data after July 2026.
A Dong-A Ilbo analysis of the same kind of data, covering 15 tourist areas during peak months from 2017 to 2025, reached the same conclusion: hourly foreign visitors fell in Myeongdong (16,034 → 9,843), Dongdaemun (4,194 → 2,746) and Namsan (1,308 → 796), and rose in Hongdae and Sinchon (3,854 → 4,794), Jamsil (2,382 → 3,901), the Yeouido and Banpo Han River parks (2,046 → 2,673), Gwangjang Market (387 → 806) and Seongsu (93 → 2,257). Its areas are drawn differently from administrative dongs, which is why its numbers differ from ours.
Where do foreign tourists spend the most money in Seoul?
Feet are spreading out, but wallets still go mainly to Myeongdong and Gangnam. Seoul city’s figures for April 2026, based on Korea Tourism Organization card data, put Gangnam-gu (29.1%) and Jung-gu, home of Myeongdong (27.5%), far ahead of Mapo-gu (7.4%), Seocho-gu (6.5%) and Jongno-gu (5.5%) in foreign card spending. Shopping made up 45.4% of that spending and medical and wellness 24.8%.
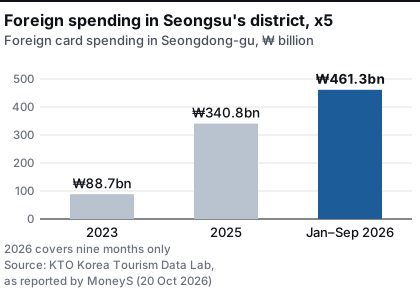
Seongsu’s district is catching up fast. MoneyS, using Korea Tourism Data Lab figures, reported that foreign card spending in Seongdong-gu reached ₩461.3 billion in January–September 2026, slightly more than Jongno-gu (₩457.2 billion), even though Jongno had more than twice as many visitors (9.99 million vs 4.55 million). Spending per visit was about ₩101,000 in Seongdong against ₩46,000 in Jongno.
Is Myeongdong dying?
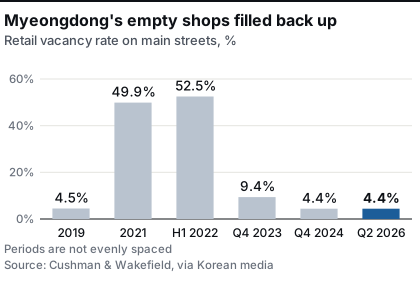
No. Myeongdong emptied out during the pandemic and then refilled. According to Cushman & Wakefield, whose figures cover Myeongdong’s main streets, the retail vacancy rate went from 4.5% in 2019 to a peak of 52.5% in the first half of 2022, then fell back to 4.4% by the end of 2024, and was 4.4% again in the second quarter of 2026. In the same quarter Seongsu was at 4.5% and Hongdae at 10.4%.
What changed is what fills the shops. The Chinese tour-group economy of the 2010s, with duty-free stores and cosmetics road shops, gave way to K-beauty multi-brand stores, sneaker and fashion stores and street food aimed at independent travelers from all over Asia and beyond. We tell that story in where Myeongdong’s road shops went.
What does this mean for your Seoul trip?
Practical tip
- First trip? Myeongdong is still the easiest base for shopping, money exchange and evening street food. Pair it with a palace morning in Jongno.
- Second trip or more? Do what repeat visitors do and give Seongsu half a day. Weekday mornings are calmer; pop-ups and flagship stores fill up after lunch and on weekends.
- Want fewer tourists? The areas growing fastest are the ones where locals also go. For neighbourhoods that are popular with Seoulites but not yet with tour groups, see where Seoul locals actually go.
- Check how busy an area is before you go with our live crowd board.
One more number from the 2025 survey: overall satisfaction was 97.5%, but “language communication” was the lowest-rated infrastructure item at 79.3%. Myeongdong’s shop staff are used to English, Japanese and Chinese; in a Seongsu side street, a translation app will do more of the work.
Sources
- Official surveys: MCST & KCTI, 2025 International Visitor Survey final report (May 2026, revised July 2026); 2019 International Visitor Survey and 2026 Q2 provisional results (Tourism Knowledge & Information System)
- Living population: Seoul Open Data Plaza, OA-14993 (short-term foreign stays by administrative dong), SeoulWindow calculation, July 2017, 2019 and 2026 files
- Spending: Seoul Metropolitan Government, April 2026 foreign card spending; MoneyS (20 Oct 2026), Korea Tourism Data Lab figures; CEO Score Daily on Musinsa Standard (11 Mar 2026)
- Foot traffic and subway: Newsis on Seoul AI Foundation analysis (22 Jul 2026); Financial News on Seoul Metro foreign rider statistics (18 Jun 2025); Herald Business on Seongsu Station (11 Aug 2026); Dong-A Ilbo living-population analysis (6 Apr 2026)
- Retail: CJ Olive Young newsroom on Olive Young N Seongsu (Nov 2025); Myeongdong vacancy from Cushman & Wakefield as reported by Asia Economy (2019–2022), Money Today (Q4 2023), Financial News (Q4 2024) and Newswire (Q2 2026)
- Arrivals: Aju Business Daily on Korea Tourism Organization 2025 arrivals (30 Jan 2026)